
What does the characteristic curve or density curve indicate?
The characteristic or density curve indicates the relationship between increasing exposures
and resulting density. By exposure (E) is meant the radiation dose on the film emulsion. It
is the product of radiation intensity (Io) and exposure time (t), therefore: E = Io.t
The ratio between different exposures and related densities is not usually plotted on a linear scale but on a logarithmic scale; i.e. density D versus log E.
The curve is obtained by applying increasing exposures to a series of successive areas of a strip of film, whereby each following exposure is a certain factor (for example 2) greater than the previous one. After development, the densities (D) are measured by means of a densitometer and then plotted against the logarithmic values of the corresponding exposures
(log E). The points obtained are then joined together by a continuous line. It is not necessary to know the absolute exposure values; relative values can be used, so at a fixed
X-ray intensity only exposure time needs to be changed.
Density (D) of a photographic emulsion does not increase linearly with exposure (E) over
the entire density range, but has a shape as in figure 2-7. The lower part of the curve (a-b)
is called the “toe”, the middle part (b-c) is called the “straight line (linear) portion”, and the
upper part (c-d) is called the “shoulder”.
The shoulder of a characteristic curve relating to industrial X-ray film corresponds to densities higher than 6. Since such densities are too high for normal film viewing, the curve from
density D = 3.5 upwards is shown as a broken line.
It should be noted that the straight-line portion (b-c) is not truly straight, but slightly
continues the trend of the toe of the curve.
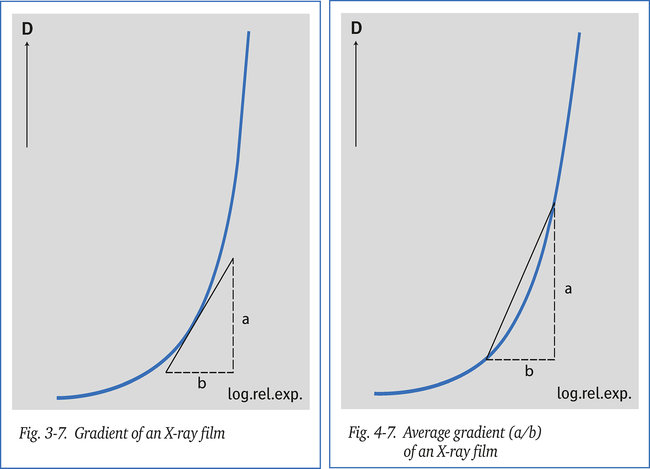
Gradient of the density curve: The density curve shows one of the most important characteristics of a film. The slope of
the characteristic curve at any given point is equal to the slope of the tangent line at this
point. This slope (a/b in figure 3-7), is called the “film gradient” GD, “film contrast” or the
“film gamma”.
Average gradient: The straight line connecting two points on a characteristic curve, as figure 4-7 shows, is equal to the “average gradient” of the segment of the curve linking these two points. This gradient (GD) is the average of all gradients in the segment between density values 3.50 and 1.50, and is a standard characteristic of a particular type of radiographic film.
In all films (for example D2 through to D8) the gradient (a/b) increases with increasing
density within the for conventional viewing screens useful density range of D<5.
The various types of films are not identical. This becomes clear if plotting the values of
gradient Gd against the density resulting in the gradient/density curves, as shown in
figure 5-7. At higher film sensitivity the gradient is lower and, hence, the density curve
less steep.
A steeper gradient means an increase in density difference at equal radiation dose and so a
greater contrast, resulting in better defect discernibility. If one requires high contrast, it is therefore necessary to use the highest possible density radiograph, while remaining within
the acceptable density range of the viewing screen so as not to impede film interpretation.
Most codes of good practice ask for densities between 2.0 and 3.0 in the relevant area of
the image. Table 1-7 shows the loss in contrast on typical film as density values obtained fall
below 3.0 .
The specimen in figure 6-7 containing a small step is radiographed with an exposure
time resulting in a density difference of 0.5 (B minus A). If now, using the same type of
film and the same tube voltage, a longer exposure time is given, the density difference
is 0.9 (D minus C). The second radiograph, therefore, shows more contrast.
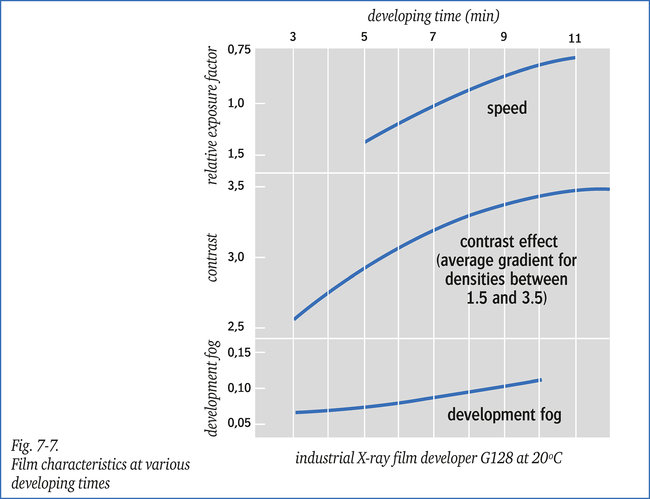
Effect of developing conditions on the density curve: The characteristic curve of an X-ray film is not only determined by the emulsion characteristics but also by the way the film is developed. Parameters which can influence the characteristic curve are: developing time and its temperature, developer concentration and agitation.
The effect of, for example, the developing time on speed (relative exposure factor),
contrast and fog, has been made visible in figure 7-7. Initially, up to approx. 4 minutes,
speed and contrast are low but increase rapidly with developing time.
From 8 minutes on, a further increase in developing time increases the background fog,
and eventually a decrease in contrast will occur.
Although it is possible to compensate, to a certain extent, for minor variations from the correct radiation exposure by adapting the developing time, normally a fixed time is maintained. In manual developing the standard time is 5 minutes. Developer type, film agitation
in the tank and temperature also influence density. That is why the overall developing process should preferably be standardised or automated. In most cases, deviating from the
optimum developing conditions leads to reduced image quality.