Image
Image
image
Eyebrow
Blog

How to describe image quality in CT images?


Understanding Image Quality in CT for NDT

A common method of describing image quality in Non-Destructive Testing (NDT) is the diameter of the smallest hole that can be visually detected. This corresponds to the fact that most defects in classical NDT are a kind of empty holes such as porosities or cracks.

The diameter of the smallest visually detectable hole is the Detail Detection Sensitivity (DDS), which can be determined directly by examining a CT slice of a Disk Image Quality Indicator (IQI).

Indirectly, but more profoundly the image quality can be described by Modulation Transfer Function (MTF), Contrast Discrimination Function (CDF) and Contrast Detail Diagram (CDD) according to ASTM E1695 and E1441. The crossing point of MTF and CDD yields the numerical limit for DDS.

Both methods provide a DDS value for the IQI and therefore do not take into account application specific CT artifacts, material inhomogeneities, etc.
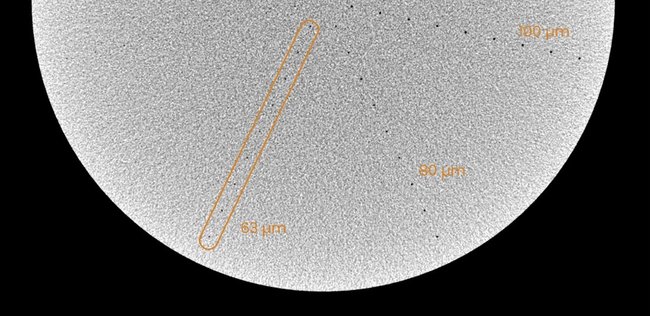


Detail Detection Sensitivity - DDS

This is a section of a CT slice of a disk IQI. The disk IQI has rows of holes arranged in a star shape, each with 9 holes of different diameters. The smallest diameter of the holes for which all 9 holes are visible, is 63 µm. The the Detail Detection Sensitivity is therefore 63 µm.

Image
image

(slice image by courtesy of Dr Uwe Ewert)


MTF, CDF, CDD and the limit of DDS

The most important factors affecting the quality of a CT image are contrast, noise, and total image unsharpness. Contrast response and noise level limit the contrast sensitivity of a CT system, i.e., its ability to detect the presence of features in an object (depending on the features’ size) by its Contrast to Noise Ratio, CNR. Geometrical and detector unsharpness limit the spatial resolution of a CT system, which reduces the ability to image fine structural details in an object by reducing their contrast. Human observers will see the combined effect of contrast, noise and unsharpness. Increased CNR will compensate increased unsharpness and vice versa. 

Per ASTM E1695 and E1441 the influence Contrast to Noise Ratio and Unsharpness in a CT scan are described by CDF and MTF, respectively. The IQI is a cylindrical rod made of homogeneous material. In the central CT slice (see image below) the yellow edge area provides the Edge Response Function (ERF), which is derived with respect to the distance from the edge of the disks to yield the Line Spread Function (LSF), from which the MTF is obtained by Fourier transformation. A statistical evaluation of the blue area yields the CDF. For the detailed numerical processes, we refer to Standard Test Method ASTM E1695 and Standard Guide E1441.

Image
image

The CDF describes the relative contrast that a feature of a given size D*(in voxels) needs to provide to visually stick out of the noise. The MTF describes the unsharpness. Its 10% value is equivalent to 2 times the Basic Spatial Resolution. The MTF decreases for smaller features reduces the contrast of smaller features. This is considered in the definition of CDD which also contains a physiological factor c which depends on the shape of the features. (For a round hole c=3.) So, in total, the CDD shows which relative contrast a hole needs to provide in the image to be recognized by the human eye under the scan conditions. The MTF shows which contrast the hole actually provides. Hence, the position of the intersection point of MTF and CDF indicates the size of the smallest hole that can be seen, the DDS.As seen from the MTF and CDD in the diagram, increased CNR will compensate increased unsharpness and vice versa. 

Image
image

For more details, see also:

Uwe Ewert, Frank Herold, Holger Roth, Florian Wohlgemuth, Numeric Prediction of the Detail Visibility in Industrial X-Ray Computed Tomography by Human Observers, 13th European Conference on Non-Destructive Testing, Lisbon, 2023, click here